8 Scenarios
The Scenarios tab is a simple tool for comparing between the different scenarios that are available in the Results tab (see again Chapter 6, and Chapter 13 for the underlying theory). Whereas in the results tab you can only view one scenario at a time, on this tab it is possible to see them in parallel and to compare between them.
8.1 Table
The main output here is the scenario comparison table. By default, this displays the ranks of each region, with columns for each scenario. The table can be sorted by clicking on the headers, allowing to sort by each scenario. The colour formatting intends to highlight where scores differ from one scenario to the next.
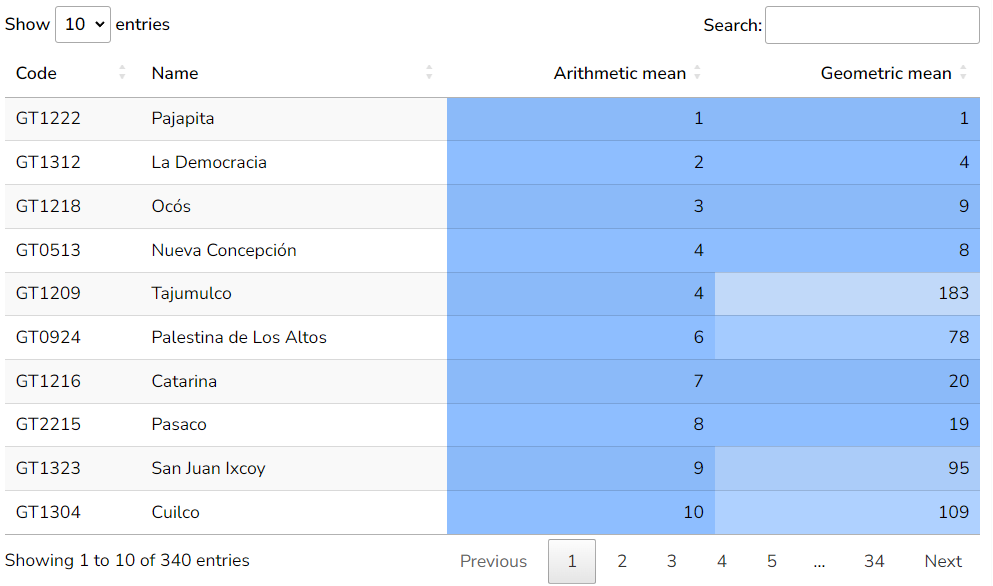
Clicking on the “gear” icon in the top right of this box gives various options for adjusting the table. In the first dropdown you can select whether to use ranks (default) or scores as the basis of comparison. In general, when comparing between different methodologies, ranks make more sense in that changing the aggregation method can lead to scores on quite different scales.
The second dropdown can be used to display either the rank/score values, or the (absolute) differences between each scenario and the “base” scenario. The base scenario is the one in the leftmost scenario column, and this can be changed by the third dropdown menu. Examining rank differences in particular is useful to highlight regions which are particularly affected by scenario changes. If a region is sensitive to the scenario, it may be worth examining it more closely to find out why, in the profile tab or else by downloading the data.
8.2 Scatter plot
The scatter plot on the right gives a visual comparison of any pair of scenarios. By default this shows the ranks of the first two scenarios plotted against each other. Hovering over each point gives the name of the region. The scatter plot is a useful visual tool to see at a glance the spread between two scenarios, and which regions change the most.
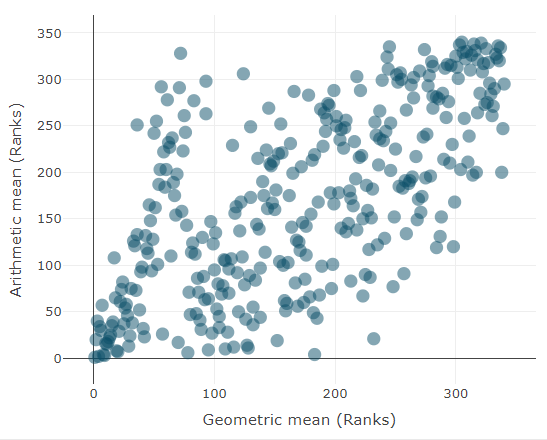
Clicking on the “gear” icon reveals some more options: you can select which scenarios to plot on the x and y axes, and also whether to plot the ranks or the scores.