Admin2 Severity Index Tool
Welcome
This is the detailed documentation of the Admin2 Severity Index Tool (A2SIT), which was developed by the UNCHR.
The aim of this documentation is to explain in detail:
- How to use the app
- The methodology behind the A2SIT
- Technical details to help maintain and expand the app
What is the A2SIT app?
The A2SIT app is a browser-based app which aims to measure “Severity” at the Admin-2 level, in order to help direct community-based protection interventions. It takes a set of user-input data and uses it to build a composite indicator of severity, as well as providing a detailed analysis of the data.
Peter maybe add some more info about the context here, or in the next chapter?
Using the app
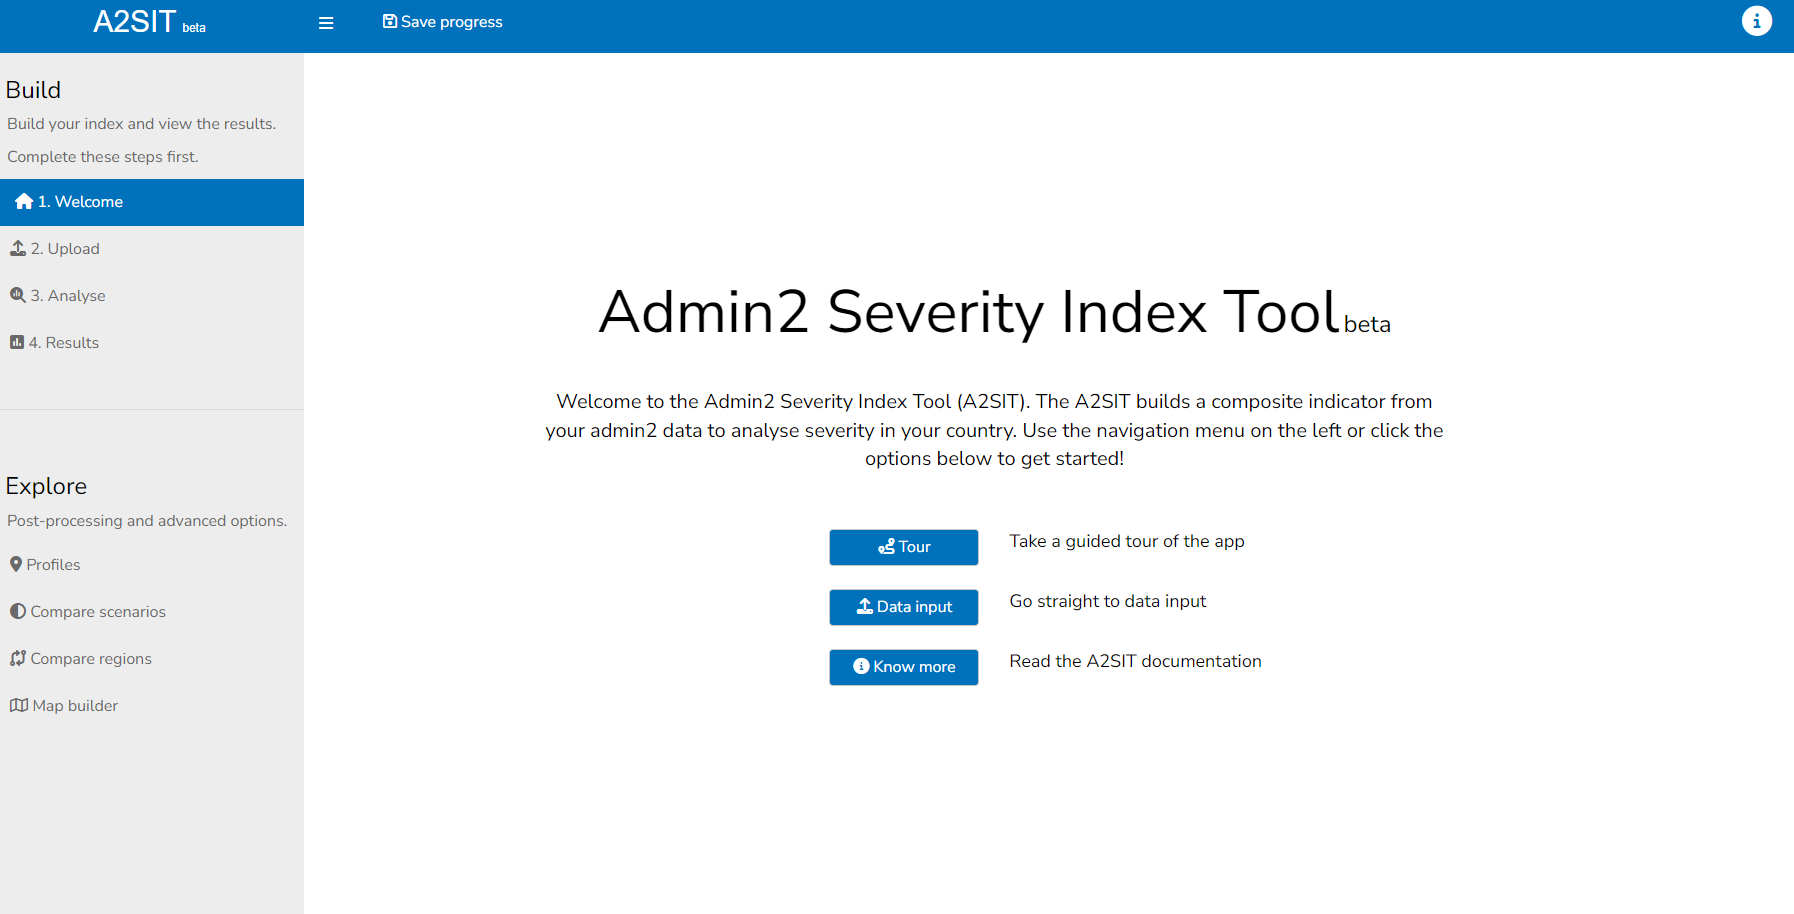
The app is hosted online here. To begin using the app, you have to download the input data template and populate it with your data, or download the example data set.
The app includes plenty of in-app guidance and hints, but the full documentation is found in this online book - in particular go to Chapter 2 to learn about the app layout, and Chapter 3 to learn how to upload your data.
As the app is wrapped in an R package, it is also possible to install and run it locally: this is explained more in Chapter 14.
Limitations
The app gives rather a lot of flexibility in that any indicator set can be used, and the structure of the index can be edited by the user. Within the app, there are also some methodological options that can be set by the user such as the aggregation method.
By default, the app is set up to take Admin-2 level data from any one of the supported countries. This is for the purposes of being able to map the indicators, so your data must:
- Be from a single (supported) country
- Be at the Admin-2 level
However, the app can also now take user-input geometry, so it is possible to work with and map indicator data from any set of geographical regions (e.g. national-level data). This is an advanced feature which requires some knowledge of spatial data files and is explained in more detail in Chapter 4.
The A2SIT app is based on the COINr package which is an R package for building and analysing composite indicators. This offers far more methodological options than those available in the A2SIT app and can be used as an alternative tool if you are comfortable working in R.
On the methodological side, consider that composite indicators are an imprecise science, and they are built using a number of assumptions, and most likely an incomplete data set due to data limitations. A composite indicator should not be viewed as a precise measure, rather as a an indication of the concept you are trying to measure. You should always investigate the raw data as well as the composite index scores, to find out why a given region scores high or low. The A2SIT app is designed to help in this respect, allowing to drill down for any given region.