10 Map builder
The Map Builder tab replicates the map on the Results tab, but provides a larger window and a number of controls to customise the appearance of the map. The idea is that users can build and customise maps which can be used as images in presentations and documents. As an overview, you can change:
- Which indicator/aggregate to plot
- The colours and number of colours
- Line styles
- The base map
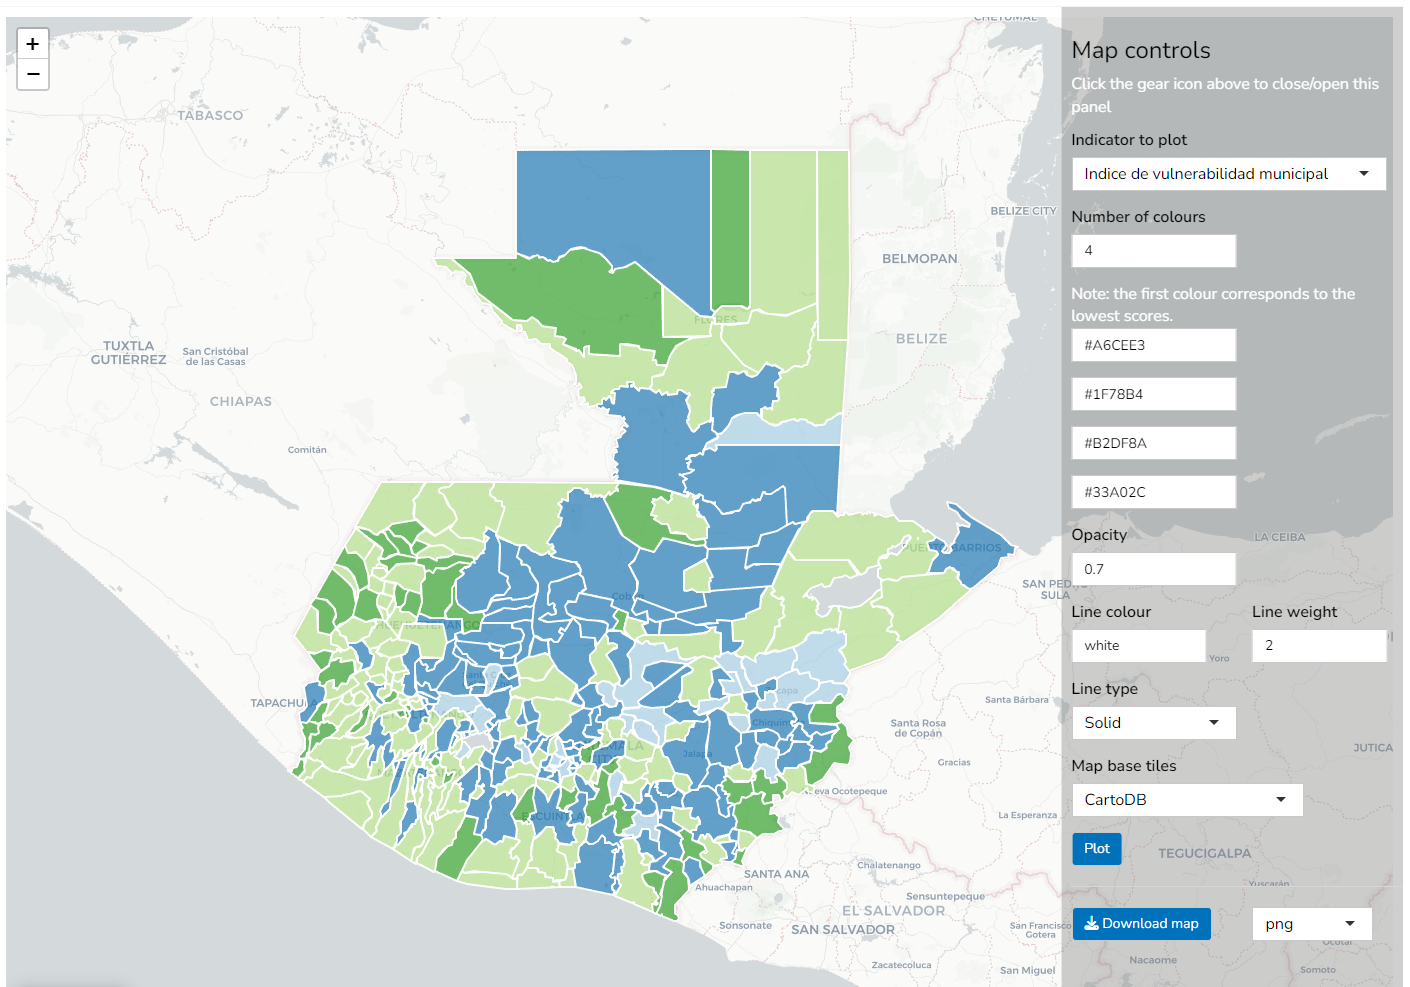
The window has a set of controls for the map in the sidebar on the right. The sidebar can be toggled by clicking the gear icon in the top right corner of the map pane. The controls are as follows. On arrival at the tab, no map is actually plotted but you can plot the map by clicking the “Plot” button at the bottom of the sidebar. Note also that every time you change an option in the si
The “Indicator to plot” dropdown selects the indicator or aggregate1 to plot. By default, it plots the index. Notice that the scores are always plotted as:
- 1-100 scores for aggregates
- Raw values for indicators
The values for each region are mapped to a colour palette by dividing the range of the selected indicator into equally-sized intervals (bins) from the minimum to maximum observed values. The resulting intervals can be seen by checking the legend of the map.
You can use the “Number of colours” input to change the number of bins used for colours. When this is changed, the number of boxes immediately below will change:
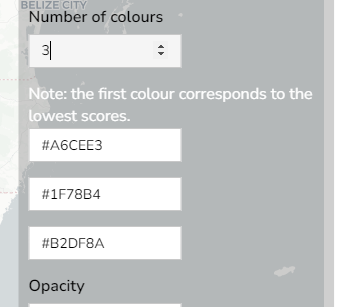
These boxes are used to input the colours to use on the map. They can take as inputs:
- HEX colour codes (e.g.
#33A02C) - colour names recognised by R (e.g.
red)
There are numerous colour palettes available. Keep in mind when picking colours:
- Whether you want to show a sequential or categorical colour scale
- It should be easy for users to distinguish between categories
- Pick a palette that is also accessible for colour-blind users
- The result should look nice!
The remaining controls on the map are:
- The opacity: a value from 0-1 specifying how opaque the colours are.
- Line colour: specifying the colour of the lines dividing the regions. Takes the same colour inputs as described previously.
- Line weight and type: the weight and type (dash, dot, solid) of the lines.
Finally, the “Map base tiles” dropdown allows to select the map that is used underneath the overlay of indicator values. This gives a range of maps that are freely available online.
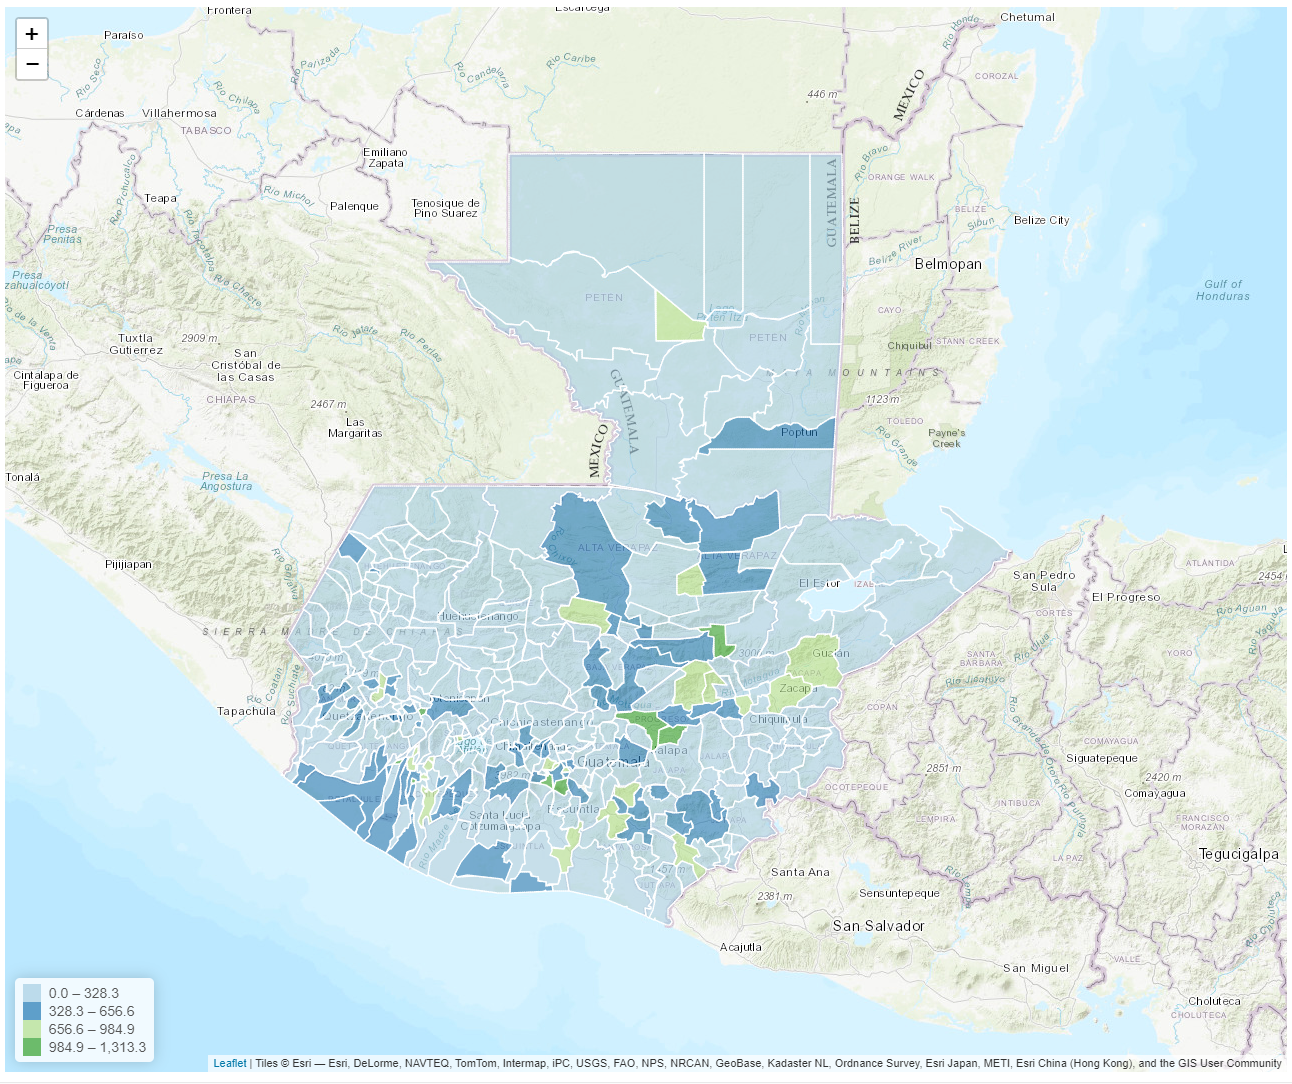
The map can also be downloaded by clicking on the “Download map” button. However, this faces the same limitations as the map download in the Results tab (see further explanation for this in Chapter 6, in the “Export” section). As such, the best option may be to simply hide the sidebars, maximise the window, and take a screenshot.
Recall that aggregates are composite scores for calculated by averaging groups of indicators.↩︎